Ctrl+K
Visualization Toolkit - Library to create high quality and interactive data visualizations - Home
  • plotly module
  • theme module
  • dash module
  • chart recipes
  • GitHub
  • plotly module
  • theme module
  • dash module
  • chart recipes
  • GitHub
  • chart recipes
  • Bar Chart Examples

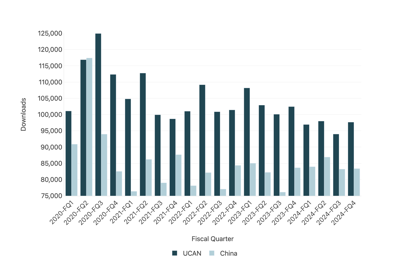
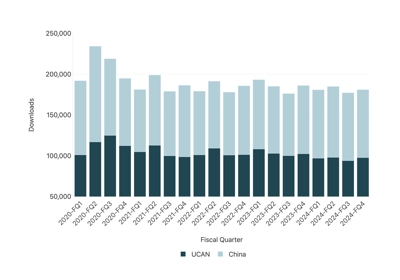
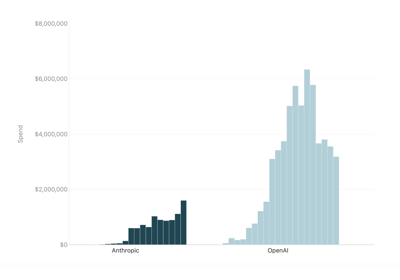
Bar Chart Examples#

See below for common bar chart options to use when creating visualizations.

Basic Bar Chart

Basic Bar Chart

Stacked Bar Chart

Stacked Bar Chart

Clustered Bar Chart

Clustered Bar Chart

previous

Numerical axis formatting and intervals

next

Basic Bar Chart

Show Source

© Copyright 2024, YipitData.

Created using Sphinx 7.3.7.

Built with the PyData Sphinx Theme 0.15.4.