Ctrl+K
Visualization Toolkit - Library to create high quality and interactive data visualizations - Home
  • plotly module
  • theme module
  • dash module
  • chart recipes
  • GitHub
  • plotly module
  • theme module
  • dash module
  • chart recipes
  • GitHub
  • chart recipes
  • Combo Chart Examples

Combo Chart Examples#

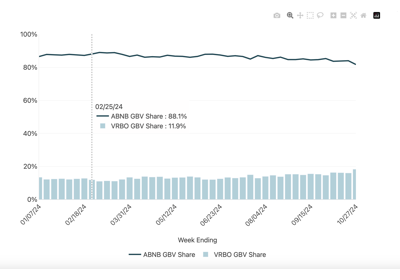
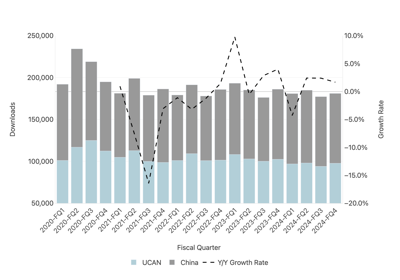
See below for combo chart options to use when creating visualizations. Combo charts are a mix of lines or bar charts.

Combo Chart on Same Axis

Combo Chart on Same Axis

Combo Charts on Different Y Axes

Combo Charts on Different Y Axes

previous

Chart Annotations

next

Combo Chart on Same Axis

Show Source

© Copyright 2024, YipitData.

Created using Sphinx 7.3.7.

Built with the PyData Sphinx Theme 0.15.4.